The report assesses the year-to-date (YTD) performance of the Market via a family of ten exchange-traded funds (ETF). The following report identifies the monthly percent (%) gain/loss of the ETF, assesses the correlation between the ETFs, and provides a discourse of the market.
ETF Performance
The uncertainty and conviction of the market was at an all-time high in 2020; volatility surged and it created intriguing month-to-month fluctuations. The table below identifies the monthly return of ten Spyder (SPDR) ETFs and highlights the upheaval that occurred in March and the hasty recovery in the successive months.
| Monthly Return of SPDR ETF's | ||||||||||
|---|---|---|---|---|---|---|---|---|---|---|
| XLB | XLC | XLE | XLF | XLI | XLK | XLP | XLU | XLV | XLY | |
| Jan | −5.06% | −0.65% | −11.79% | −3.60% | −2.29% | 2.08% | 1.12% | 8.10% | −2.93% | −1.25% |
| Feb | −8.52% | −5.84% | −15.29% | −11.25% | −9.90% | −7.30% | −8.21% | −9.86% | −6.59% | −7.57% |
| Mar | −14.00% | −12.60% | −34.37% | −21.04% | −18.63% | −8.58% | −5.53% | −10.00% | −3.89% | −14.91% |
| Apr | 15.19% | 13.65% | 30.76% | 9.46% | 8.81% | 13.74% | 6.96% | 3.34% | 12.59% | 18.88% |
| May | 6.88% | 7.44% | 2.00% | 2.72% | 5.39% | 7.18% | 1.66% | 4.24% | 3.29% | 6.51% |
| Jun | 2.18% | 0.24% | −1.10% | −0.52% | 1.97% | 6.95% | −0.22% | −4.67% | −2.44% | 3.07% |
| Jul | 7.12% | 7.57% | −4.81% | 3.85% | 4.41% | 5.68% | 6.92% | 7.80% | 5.46% | 7.27% |
| Aug | 4.36% | 8.83% | −1.05% | 4.29% | 8.48% | 11.88% | 4.59% | −2.60% | 2.59% | 9.55% |
| Sep | 1.51% | −5.90% | −14.61% | −3.42% | −0.68% | −5.34% | −1.67% | 1.08% | −2.18% | −1.86% |
| Oct | −0.72% | −0.34% | −4.11% | −0.87% | −1.44% | −5.00% | −2.87% | 5.05% | −3.62% | −2.73% |
| Nov | 12.36% | 10.47% | 27.99% | 16.85% | 16.03% | 11.38% | 7.47% | 0.74% | 7.95% | 10.00% |
| Dec | 2.09% | 2.52% | 5.36% | 5.01% | 0.54% | 5.39% | 0.94% | −0.86% | 2.72% | 2.37% |
| Total | 23.39% | 25.39% | −21.02% | 1.48% | 12.69% | 38.06% | 11.16% | 2.36% | 12.95% | 29.33% |
The total year-over-year (YoY) percent gain for all, but one of the ETFs, was surprisingly positive. XLK (Tech), XLY(Consumer Discretionary), and XLC (Communication Services) were the % YoY leaders, while XLE and XLF were the losers.
ETF Correlation
We identified the degree to which funds are correlated. In a year where unemployment skyrocketed, an oil crisis occured, and an election loomed, there were many catalysts that shifted and transformed the mindset of investors and the market. New relationships between sectors were discovered and existing relationships were strengthened. The correlation plot below depicts the correlation coefficients of ten SPDR ETFs in 2020.
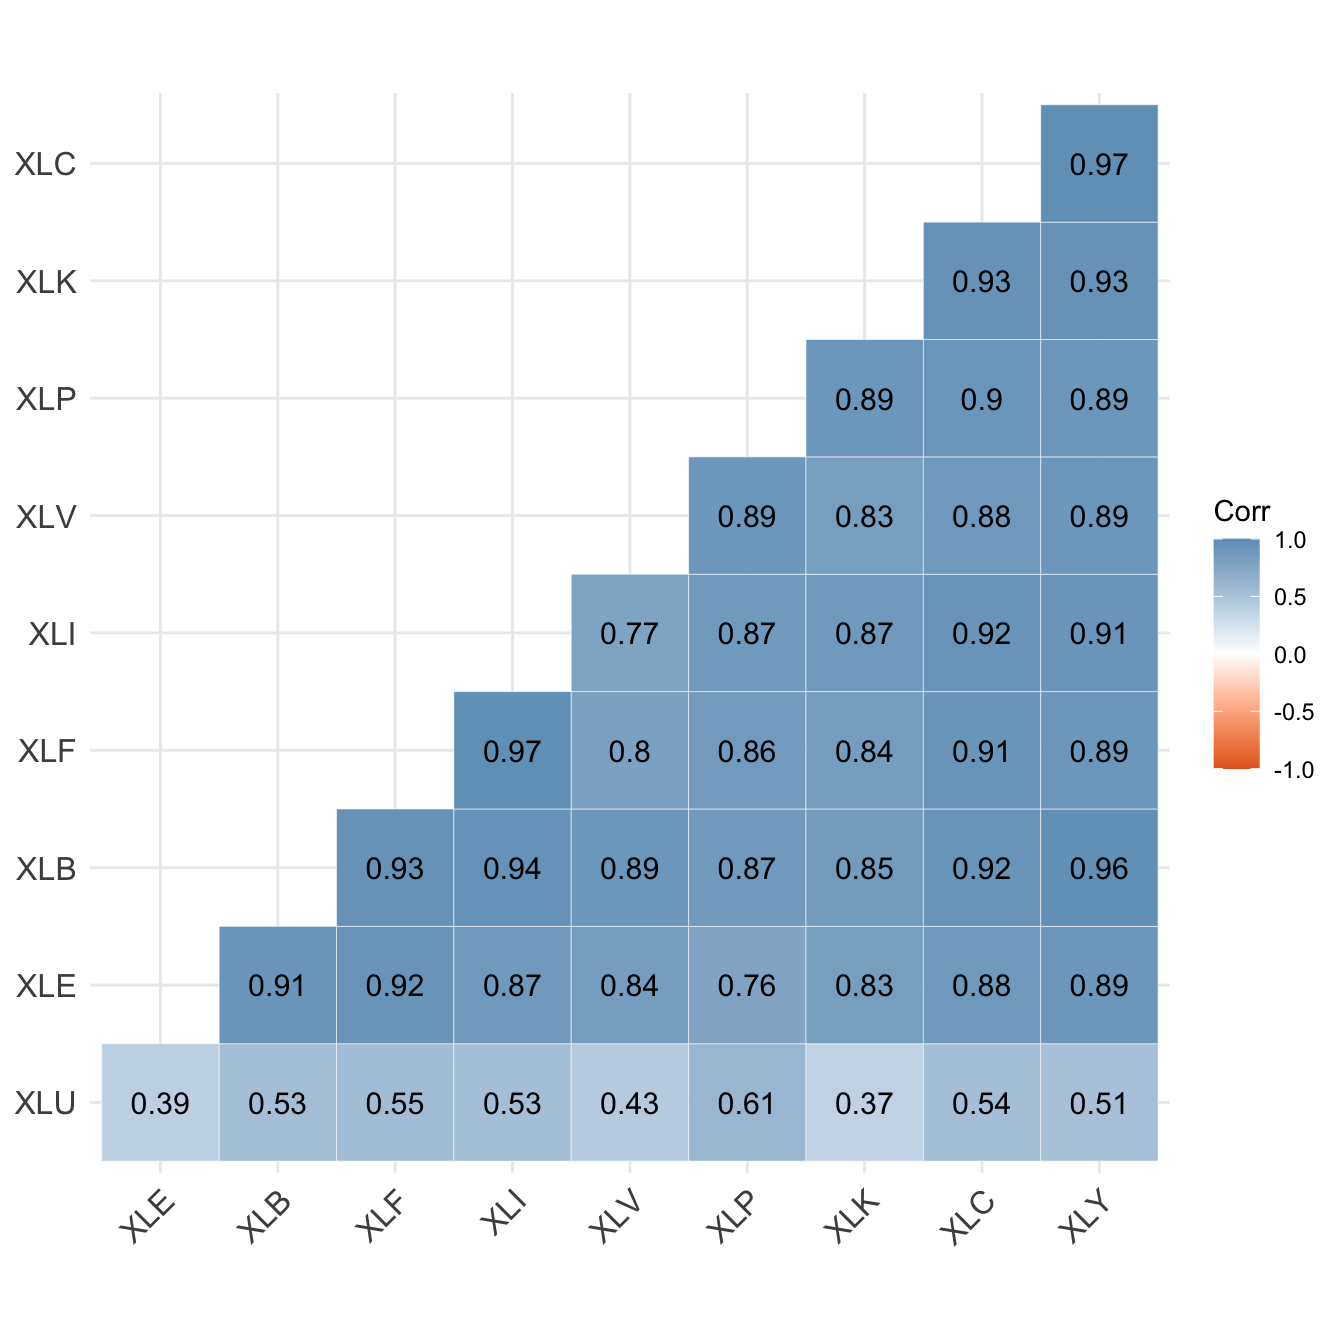
We observed that Financials and Industrials had the highest correlation, while Utilities and Technology and Energy and Utilities had the lowest correlations. XLE’s relationship with each of the other ETFs is interesting. Prior to 2020, XLE had been trading within a range. XLE’s five year performance (as of January 1, 2021) had been a net loss of 37%. However, it’s performance over the last year was a net loss of 36%; XLE did not have a great year.
Market Analysis
ETFs aim to track specific industry sectors, XLK tracks the Tech sector, while XLF tracks the Financial sector. To get a better sense of the leading sectors in 2020, we were curious if trends played any part in the success of the top-gaining sectors and companies within these sectors. We pinpointed trends that broke out and developed momentum in 2020 and found the following:
- PC Gaming
- D-I-Y and Gardening
- Health and Sustainability
- Working from Home (WFH)
The trends observed had many qualities in common, the trends were more centered around the individual, than the collective. Additionally, the trends had sector/stock counterparts. Tech, consumer discretionary, and communication services companies embodied the characteristics of the trends. In parallel, they stood to gain. Some of the companies that benefited in 2020 included:
- Tech (XLK): Adobe, Nvidia, Paypal
- Consumer Discretionary (XLY): Amazon, Home Depot, and Target
- Communication Services (XLC): Facebook, Alphabet, Netflix
The companies listed, on top of being positioned well, had products and services that tailored well to a pandemic-filled world. From touch-less payment software, to home improvement, to over-the top streaming content. They were innovative; they were adaptive. Trends that budded in 2020 may have helped to assist these sectors notoriety in some way, but many of the companies increased their relevancy and made inroads by offering products and services that consumers needed and wanted.
Conclusion
From it being an election year and the breakout of a pandemic, 2020 had many catalysts that shifted the outlook for the consumers, the economy and the stock market. The report showcases the bullish run of the technology sector and the lackluster performance of the energy sector (partly due to increasing concerns of climate change and expectation of a new “greener” president). With a vaccine being available (and in distribution across many states), and a new president being sworn in, we expect the market to cool off post-February. Stock prices and market indexes have risen to all-time highs and we believe the market has been fueled by ever-increasing euphoria, positive vaccine news, and new-found stimulus checks.